First pulsar observation
The weekend of 18/19 October was a busy weekend for the Dwingeloo Telescope. From Friday evening to Saturday morning there was an EME contest and on Sunday the open day. In between, on Saturday afternoon and evening, Paul Boven (PE1NUT) and Pieter-Tjerk de Boer (PA3FWM) were in the Dwingeloo Telescope to try again some radio astronomical observations, with the hope of finally receiving a pulsar. Paul had been preparing that for a long time: figuring out what techniques are needed for this and calculating what should be possible with the Dwingeloo Telescope.
A pulsar is a neutron star that rotates quickly around its axis and thereby emits a bundle of radio waves. That bundle “swings” through the universe as if it were a cosmic lighthouse. Looking (with the Dwingeloo Telescope) from the earth to such a pulsar, we see a periodic, short-term increase in the noise level (because a pulsar does not transmit a nice carrier, but broadband noise). Unfortunately, that noise increase is quite small compared to the background noise. To be able to observe the pulsar, you have to be able to measure the noise level very precisely, otherwise the periodic increase disappears (literally) in the noise.
You can measure a noise level precisely by measuring over a large bandwidth and averaging out for a long time. In the past people used to make beautiful analog constructions for this, but nowadays it is most convenient to make the noise to be measured digitally via an analog-to-digital converter and then start calculating with digital hardware or software.
A first attempt to detect a pulsar in July, using the WebSDR hardware with 48 kHz bandwidth, unfortunately failed. That is why both Paul and I had now brought heavier guns: AD converters with tens of MHz bandwidth and behind that an FPGA (programmable digital logic) for further processing. Unfortunately, Paul’s construction in the Dwingeloo Telescope turned out not to work (at home it worked, both in advance and afterwards!) So that we ultimately had to do with just my structure (which was actually developed for shortwave reception).
Because our circuits do not work directly on 70 cm or 23 cm, down converters were needed:
- for 70 cm a Rohde & Schwarz receiver with MF output present in the Dwingeloo Telescope;
- for 23 cm the LT23 transverter from Jan van Muijlwijk (PA3FXB) that was previously used for the WebSDR.
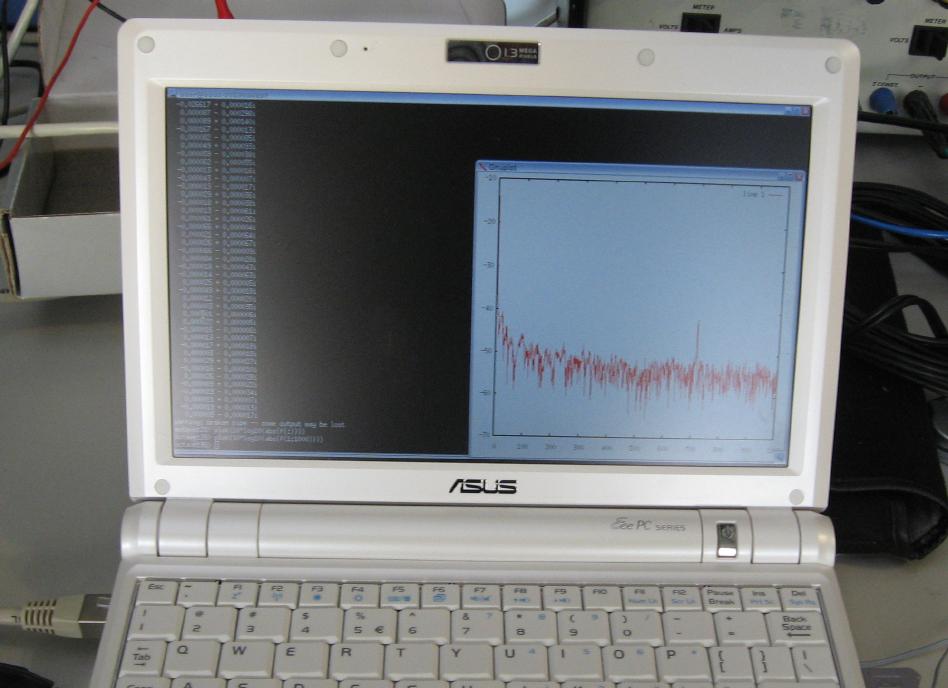
We first focused – and the Dwingeloo Telescope – on the strongest pulsar on the firmament: PSR B0329 + 54 with a period of 0.715 seconds and a pulse duration of 6.6 milliseconds. The first attempt to observe this at 70 cm where he theoretically had to be a lot stronger than at 23 cm failed. But at 23 cm it worked and that initially looked like in figure 1.
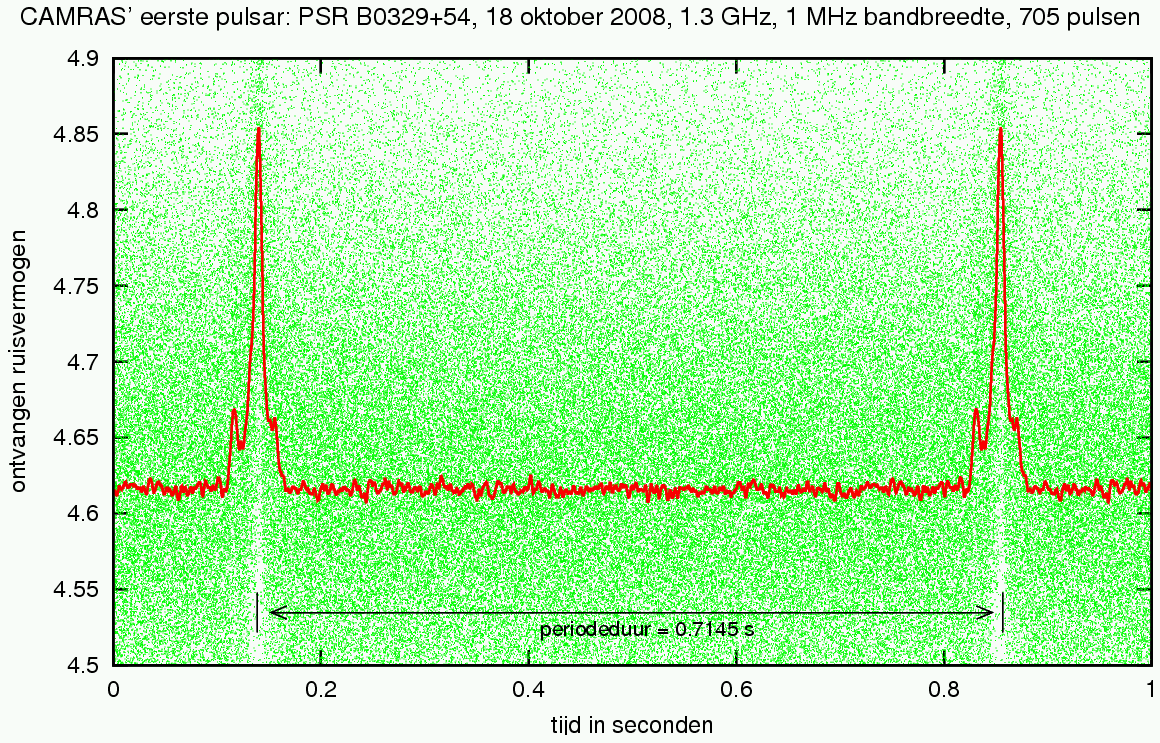
The graph on the laptop is a mathematical operation (Fourier transformation) of a few minutes of received noise power and the peak indicates that there is “something” periodically with a period of more than 0.7 seconds. This shows the presence of the pulsar, but you actually want to make a graph of the pulse shape itself. Unfortunately, each individual pulse is too weak to make a nice graph of it, but you will get a nice graph if you slide a lot of consecutive pulses over each other and then mediate. In the graph of Figure 2, the green dots are the individual measured noise levels and the red line is the average thereof over a total of 705 pulses.
Note that in the raw data (the green dots) you can barely see that there is a periodic increase. After averaging (the red line) it is clear that the pulsar 1 has a sharp peak, but also that it still has “shoulders” before and after (which is also known from the scientific literature).
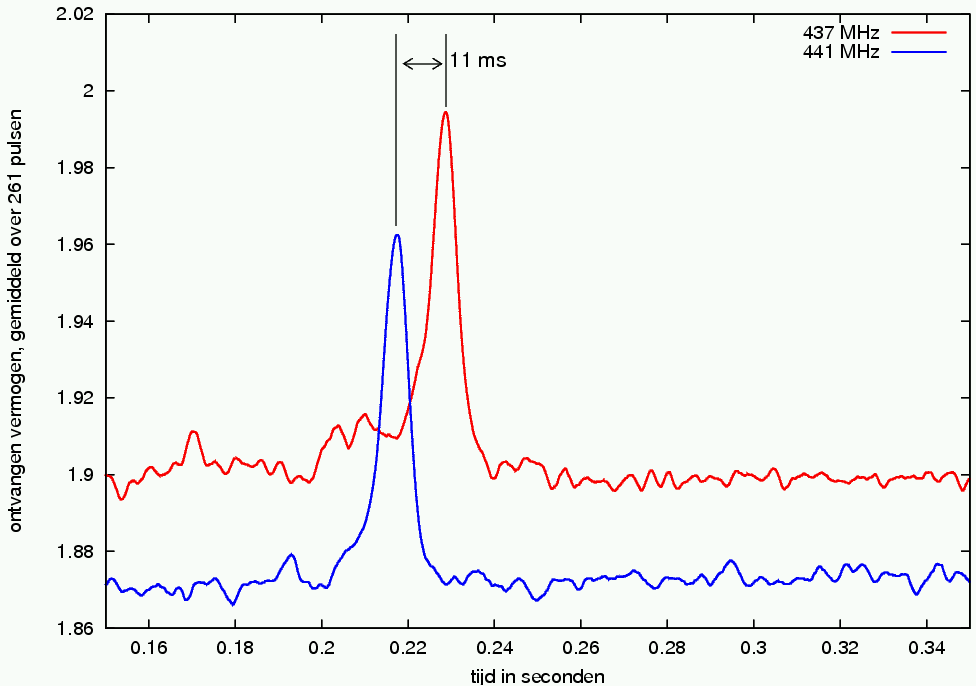
After the success at 23 cm it was also possible to fish the pulsar at 70 cm from the noise. In addition, a characteristic phenomenon could be observed: dispersion. This means that the pulsar signals do not arrive on earth at exactly the same time on all frequencies: the lower the frequency, the longer the signal travels through the interstellar medium. We have done a measurement in two bands, each 1 MHz wide, around 437 and 441 MHz, with the graph in Figure 3 as a result.
It is clear that the pulse arrives approximately 11 milliseconds later at 437 MHz than at 441 MHz. On the other hand, the pulse shape is now much more vague than at 23 cm. This is due to the same dispersion, because it ensures that even within our 1 MHz measuring bandwidth the pulse is already “spread out.” This immediately makes one of the challenges for further observations clear: in order to be able to measure more sensitively (for weaker pulsars), we would like to measure in even more bandwidth, but then the dispersion will cause even more smear. Compensation must therefore be made for this: a frequency-dependent delay is required.
Another challenge is the fact that especially at 70 cm it is difficult to find 1 MHz of “clean” bandwidth, let alone more. The spectrum analyzer shows that a lot of earthly signals enter the setup. How is still unclear, so perhaps there is still something to be gained with shielding; otherwise we will have to filter. Furthermore, it would be nice for demonstrations if we could increase the sensitivity to such an extent that we could receive the strongest pulsar “live” instead of an analysis afterwards, for example by ear or with an oscilloscope.
